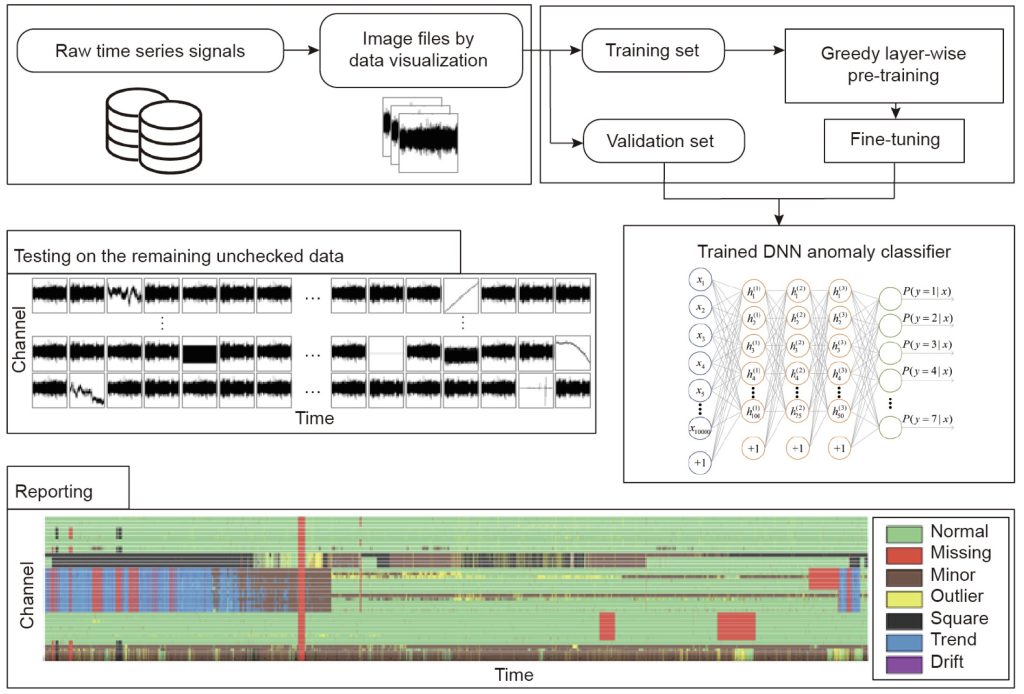
Abstract: Structural health monitoring (SHM) is a multi-discipline field that involves the automatic sensing of structural loads and response by means of a large number of sensors and instruments, followed by a diagnosis of the structural health based on the collected data. Because an SHM system implemented into a structure automatically senses, evaluates, and warns about structural conditions in real time, massive data are a significant feature of SHM. The techniques related to massive data are referred to as data science and engineering, and include acquisition techniques, transition techniques, management techniques, and processing and mining algorithms for massive data. This paper provides a brief review of the state of the art of data science and engineering in SHM as investigated by these authors, and covers the compressive sampling-based data-acquisition algorithm, the anomaly data diagnosis approach using a deep learningalgorithm, crack identification approaches using computer vision techniques, and condition assessment approaches for bridges using machine learning algorithms. Future trends are discussed in the conclusion.
You may also like
In structural health monitoring (SHM), revealing the underlying correlations of monitoring data is of considerable significance, both theoretically and practically. In contrast to the traditional correlation analysis for numerical data, this study seeks to analyse the correlation of probability distributions of inter-sensor monitoring data. Due to induced by some commonly shared random excitations, many structural responses measured at different locations are usually correlated in distributions. Clarifying and quantifying such distributional correlations not only enables a more comprehensive understanding of the essential dependence properties of SHM data, but also has appealing application values; however, statistical methods pertinent to this topic are rare. To this end, this article proposes a novel approach using functional data analysis techniques. The monitoring data collected by each sensor are divided into time …
Compressive sensing has been studied and applied in structural health monitoring for data acquisition and reconstruction, wireless data transmission, structural modal identification, and spare damage identification. The key issue in compressive sensing is finding the optimal solution for sparse optimization. In the past several years, many algorithms have been proposed in the field of applied mathematics. In this article, we propose a machine learning–based approach to solve the compressive-sensing data-reconstruction problem. By treating a computation process as a data flow, the solving process of compressive sensing–based data reconstruction is formalized into a standard supervised-learning task. The prior knowledge, i.e. the basis matrix and the compressive sensing–sampled signals, is used as the input and the target of the network; the basis coefficient matrix is embedded as the parameters of a certain …
Structural health monitoring (SHM) systems provide opportunities to understand the structural behaviors remotely in real-time. However, anomalous measurement data are frequently collected from structures, which greatly affect the results of further analyses. Hence, detecting anomalous data is crucial for SHM systems. In this article, we present a simple yet efficient approach that incorporates complementary information obtained from multi-view local binary patterns (LBP) and random forests (RF) to distinguish data anomalies. Acceleration data are first converted into gray-scale image data. The LBP texture features are extracted in three different views from the converted images, which are further aggregated as the anomaly representation for the final RF prediction. Consequently, multiple types of data anomalies can be accurately identified. Extensive experiments validated on an acceleration dataset acquired on a …
Structural health monitoring systems continuously monitor the operational state of structures, generating a large amount of monitoring data during the process. The structural responses of extreme events, such as earthquakes, ship collisions, or typhoons, could be captured and further analyzed. However, it is challenging to identify these extreme events due to the interference of faulty data. Real-world monitoring systems suffer from frequent misidentification and false alarms. Unfortunately, it is difficult to improve the system’s built-in algorithms, especially the deep neural networks, partly because the current neural networks only output results and do not provide an interpretable decision-making basis. In this study, a deep learning-based method with visual interpretability is proposed to identify seismic data under sensor faults interference. The transfer learning technique is employed to learn the features of seismic data and faulty data with efficiency. A post-hoc interpretation algorithm termed Gradient-weighted Class Activation Mapping (Grad-CAM) is embedded into the neural networks to uncover the interest regions that support the output decision. The in-situ seismic responses of a cable-stayed long-span bridge are used for method verification. The results show that the proposed method can effectively identify seismic data mixed with various types of faulty data while providing good interpretability.